


What are KPIs?
If you’re anything like us, you spend a lot of time thinking about KPIs. Key Performance Indicators (KPIs) are typically measurable figures that clearly show how you and your team are performing. Metrics like revenue, customer acquisition cost (CAC), website traffic or customer lifetime value (CLTV) are tracked, measured and used to judge how well your team is performing.
These KPIs can be used to regularly measure and track your business performance and can be assigned to whole business units, smaller teams, and even individual contributors. It’s worth noting here that KPIs vary a lot depending on what your company or team needs to achieve. KPIs within a SaaS company probably look different from those at an e-commerce startup or a charitable organisation.
With that in mind, here are some examples of KPIs commonly used to track performance in growth-focused companies:
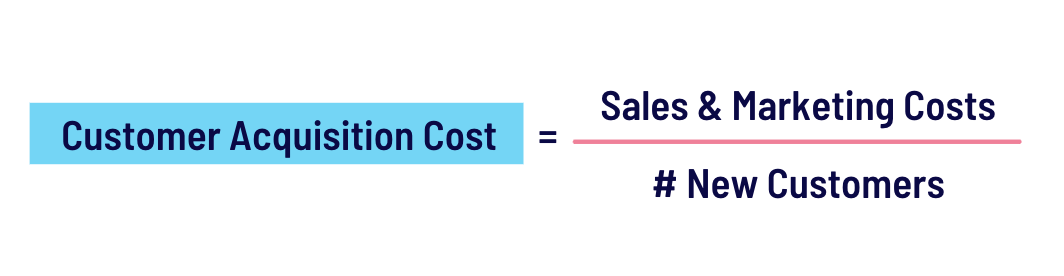
Customer Acquisition Cost (CAC)
How much is it costing your sales and marketing teams to bring on each new customer? Use this simple equation to figure it out:
Customer Lifetime Value (CLTV)
How much is each customer worth over their lifetime as a customer? Do they buy once and never come back? Do they refer others to your business? Do they come back for more? All of these things factor into determining the lifetime value of each customer.
CLTV = Lifetime value ($) X Average customer lifespan
Website Traffic by Source
How are people getting to your website? Commonly tracked sources are direct, paid, organic, referral, social and email, but depending on your ways of working, others may be more logical.
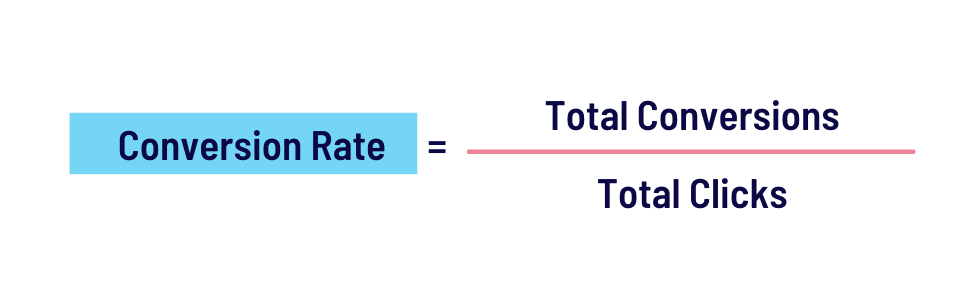
Landing Page Conversion Rates
How many of your landing page visitors take the action you want them to when they’re on your landing pages? Maybe you want them to sign up to your newsletter, add an item to their cart or make a donation. The formula looks like this:
Leads, MQLs, SQLs and Opportunities
Speaking of leads, it’s important to define how users will move along the marketing funnel and measure each stage of this. How many visitors become leads, how many leads become MQLs, and eventually how many people become customers?
Revenue/Profit
This one may seem a bit obvious, but it’s important to know how much money is coming in, and what your profit margins are looking like.
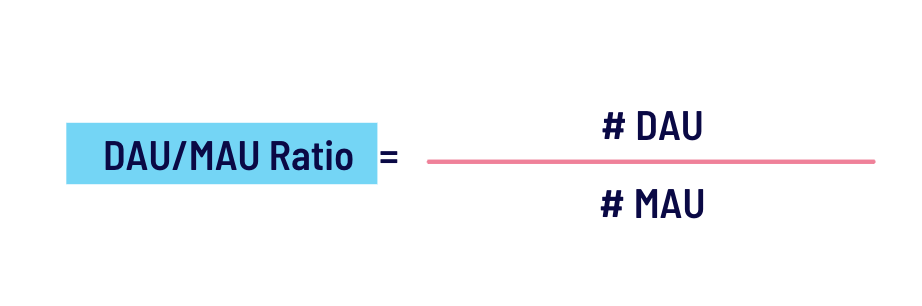
Daily Active Users (DAU)
One of the most important metrics for SaaS companies and apps is Daily Active Users. This KPI measures the number of unique active users who visit your platform in a single day. Tracking this over time gives you a good idea of retention and usage. It’s also a great springboard for further analysis. DAU can also be compared to MAU (Monthly Active Users) to determine how often users return. A DAU/MAU ratio of over 20% is considered good, and platforms that achieve 50% or more (like Facebook) are excellent, according to CleverTap.
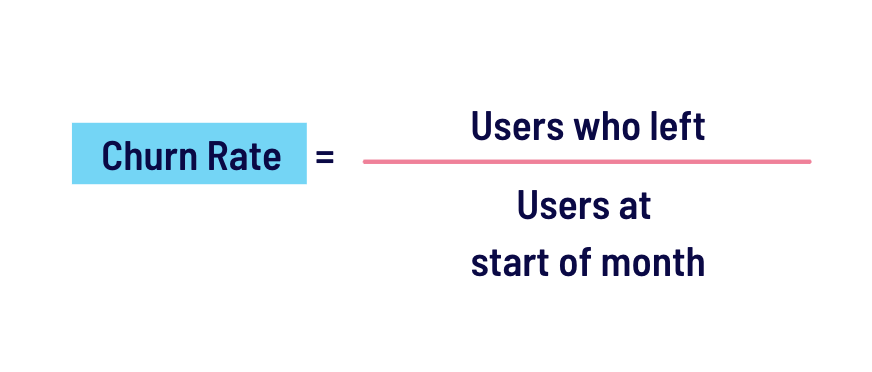
Churn rate
If your product or service is something people should be using regularly and continually, like software, churn is one of the most important things to measure. Churn rate simply measures what percentage of your users/customers you lost. It’s quite simple really, in order to grow, you need to maintain existing users, and acquire new ones. Here’s the formula for monthly churn:
Leading vs Lagging Indicators
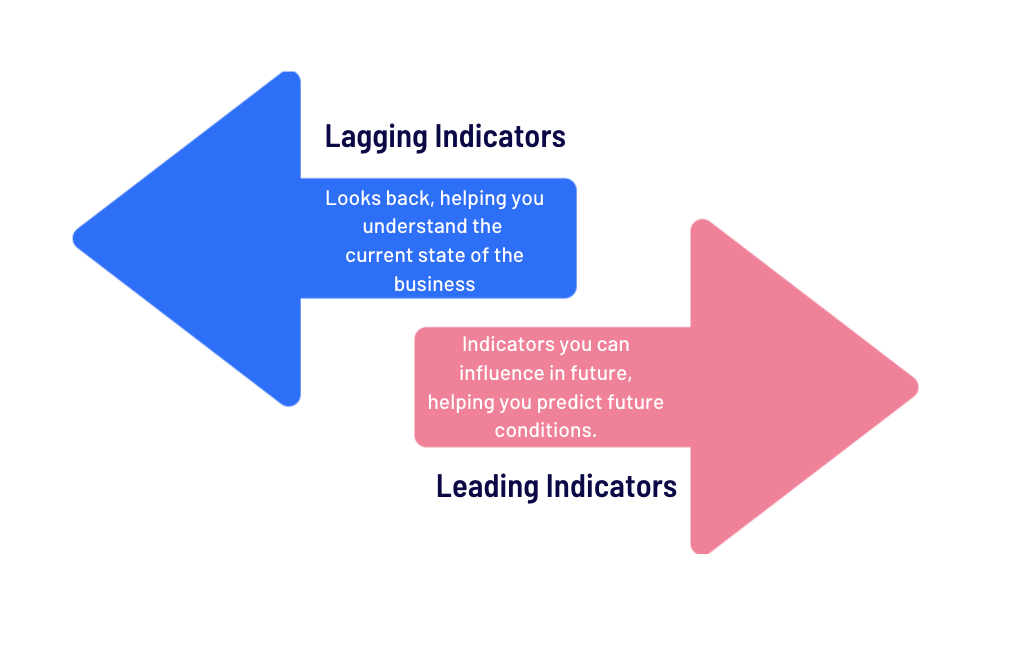
It’s important to remember that your KPIs don’t exist in a vacuum. Your company’s conditions will change, and it’s important to keep that in mind when choosing which KPI to use when. A good framework for this is to look at Leading vs Lagging Indicators.
Put simply: Lagging indicators help you understand a business’s current state, whilst leading indicators help you predict future conditions and make projections.
For example, Churn Rate is a lagging indicator, telling us what’s already happened. Daily Active Users, on the other hand, is a leading indicator, as we can actively influence it going forward.
When you use which type of KPI is very much dependent on your goals, but one common approach is to report on lagging indicators at more regular intervals, and space out when you use leading indicators. Here at Growth Tribe we report key lagging indicators on a weekly basis and look ahead with leading indicators in our monthly reviews.
So, what are OKRs?
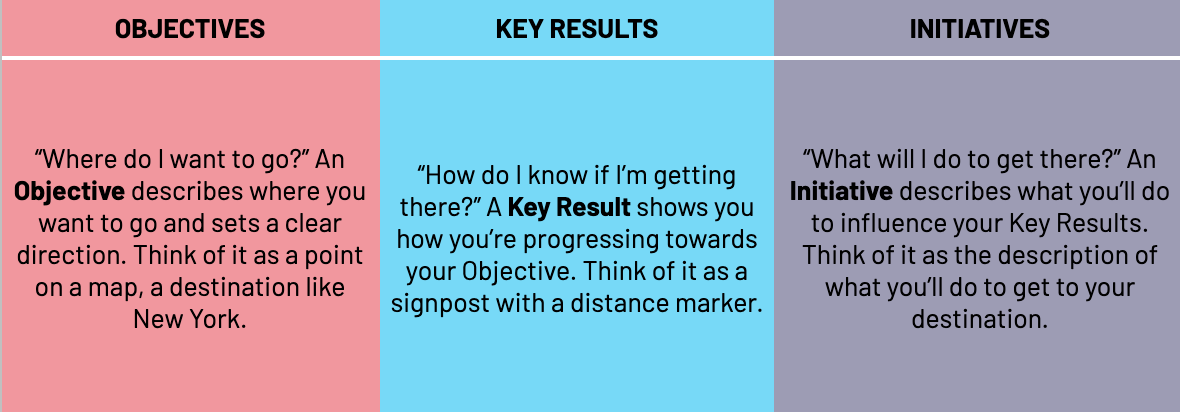
OKR stands for Objectives and Key Results. Popularised by the book ‘Measure what Matters’ where John Doerr explains where the idea came from and how he managed to convince the Google C-Suite to adopt it, OKRs are a goal-setting framework that kicks the concept of KPIs up a notch and connects key results to broader objectives.
OKRs define areas you want to improve (objectives) and the key results you need to achieve to get there. These objectives can be linked to any area of your business and should be high-level. Here are some examples:
- Improve company reputation online
- Increase product engagement
- Create a more personalised sales approach
- Move towards account-based marketing in division X
- Increase the number of MQLs
Ideally, these team objectives should be aligned with a company-wide one. For example: if my company needs to increase revenue by 10%, one objective I could set would be ‘increase demand for product X’ or ‘generate more MQLs’.
As you can see from these examples, they’re pretty broad, so that’s where Key Results and Initiatives come in.
-1.png)
What do OKRs look like in practice?
Once you’ve got an idea of where you want to go, how you’ll know if you’re making progress, and the initiatives you can take to make progress, it’s time to get all that structured!
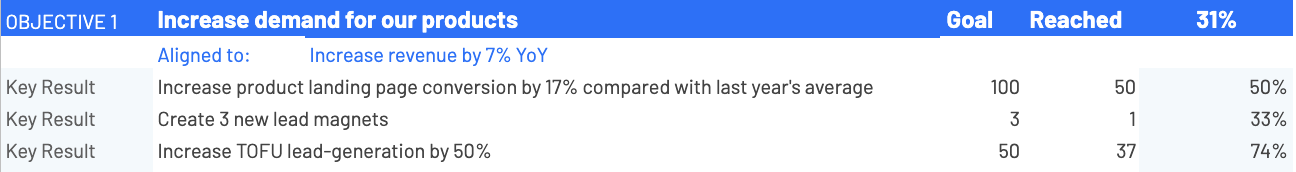
First define your objective, in this case, ‘Increase demand for our products,’ and align it with a company-wide goal, like ‘Increase revenue by 7% YoY.’
Once you’ve done that, translate your goal into a number so you can keep track of how far you’ve come.
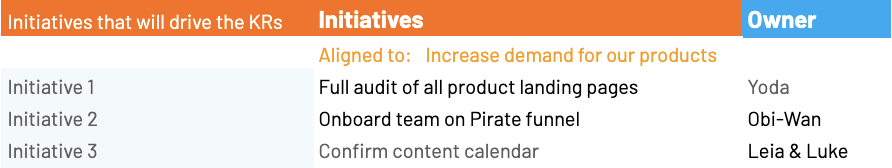
Once you’ve defined your OKRs, it’s time to look at initiatives and ownership. Decide as a team which initiatives will help you achieve your key results, and assign them to a specific owner.
In our example, we’re asking Yoda to audit all product landing pages, whilst Obi-Wan gets the marketing team up to speed on the pirate funnel. Both of these initiatives will help the team achieve their key results.
What should you be using to measure success?
Ultimately, it’s up to you, of course. However, we’re into OKRs, you can keep your KPIs as objectives, and start viewing them in a wider context. By connecting objectives to company goals, key results you want to achieve and specific initiatives owned by specific teammates, you have a much broader and holistic view of your team’s goals.
If you’re keen to get started, we recommend checking out John Doerr’s groundbreaking book on the subject, Measure what Matters.
We’ve also developed a free OKR Tracking Template you can access right now and use to start planning your own OKRs. The template includes a Guide to OKRs as well as a tracking sheet you can start using right away!
Related articles


Latest articles

ChatGPT Search Unveiled: Should You Make The Switch Now?
Picture this: You’re no longer just “searching” the web—you’re...

Shadow AI Explained: How to Harness Hidden AI Without the Risks
Picture this: your team is under pressure to deliver results—fast....
The 33 best AI tools for commercial teams
The tools are split into 2 categories The best AI tools for your...

B2B Growth Blueprint: How to Drive Sales and Build Strong Partnerships
In today’s fast-paced world, B2B companies are like ships...